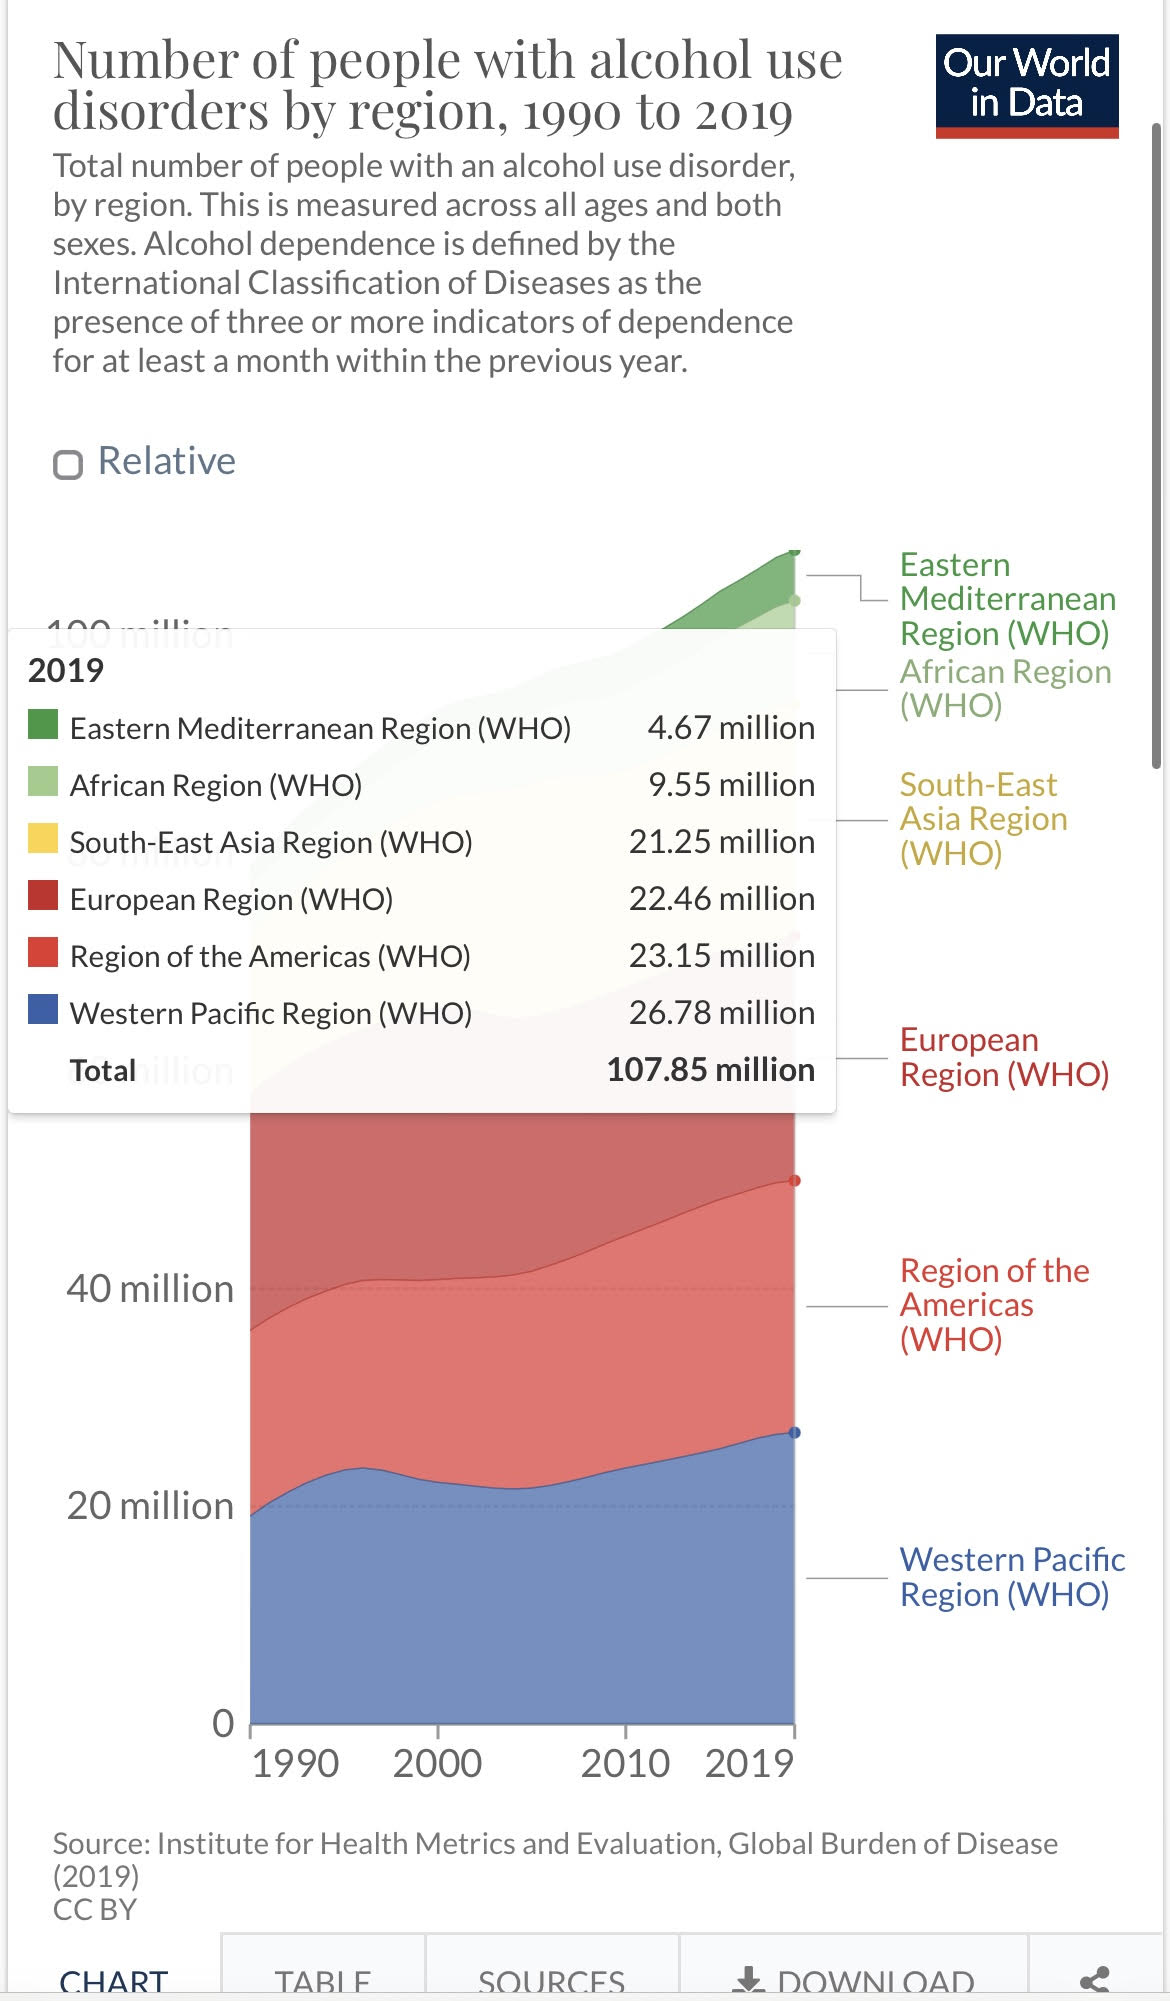
I downloaded alcohol disorder rates data from Our World in Data. I selected this data because I’m interested in the alcohol use disorders by region from 1990 to 2019.
This is the link to the data.
The following code chunk loads the package I will use to read in and prepare the data for analysis.
- Read the data in
- Use glimpse to see the names and types of columns.
glimpse(number_with_alcohol_disorders_by_region)
Rows: 6,840
Columns: 4
$ Entity                                                                    <chr> …
$ Code                                                                      <chr> …
$ Year                                                                      <dbl> …
$ `Prevalence - Alcohol use disorders - Sex: Both - Age: All Ages (Number)` <dbl> …
# View(number_with_alcohol_disorders_by_region)
- Use output from glimpse (and View) to prepare the data for analysis
Create the object “regions” that is list of regions I want to extract from the data set.
Change the name of the 1st column to Region and the 4th column to Number od People.
Use filter to extract the rows that I want to keep: Year >= 1990 and Region in regions
Select the columns to keep: Region, Year, NumberofPeople
Assign the output to regional_disorders
Display the first 10 rows of regional_disorders
regions  <- c( "European Region (WHO)",
               "Eastern Mediterranean Region (WHO)",
               "South-East Asia Region (WHO)",
               "African Region (WHO)",
               "Region of the Americas (WHO)",
               "Western Pacific Region (WHO)" )

regional_disorders <- number_with_alcohol_disorders_by_region  %>%
  rename(Region = 1, NumberofPeople = 4)  %>%
  filter(Year >= 1990, Region %in% regions)  %>%
  select (Region, Year, NumberofPeople)

regional_disorders
# A tibble: 180 × 3
   Region                Year NumberofPeople
   <chr>                <dbl>          <dbl>
 1 African Region (WHO)  1990        4230659
 2 African Region (WHO)  1991        4350481
 3 African Region (WHO)  1992        4454542
 4 African Region (WHO)  1993        4557674
 5 African Region (WHO)  1994        4684458
 6 African Region (WHO)  1995        4828676
 7 African Region (WHO)  1996        4985429
 8 African Region (WHO)  1997        5138606
 9 African Region (WHO)  1998        5283007
10 African Region (WHO)  1999        5425882
# … with 170 more rows
Check that the total for 2019 equal the total in the graph
# A tibble: 1 × 1
  total_nmr
      <dbl>
1 107852244
Add a picture.
Write the data to file in the project directory
write_csv(regional_disorders, file= "number_with_alcohol_disorders_by_region.csv" )